Research data management with RStudio
Disclaimer: I am not a data management librarian, but I am currently learning about data management to manage my research datasets more effectively.
I recently collaborated with my colleague, Cecilia Tellis - Head, Design and Outreach at the uOttawa Library, to explore uoCal data which is the online campus-wide calendar of events. It was her original idea that uoCal could be used to answer her questions like where and when most events happened based on event categories. uoCal contains richful information about campus events such as date, time, location, event categories, organizers, intended audience and etc. and we believed that we could explore uoCal data to identify patterns and trends.
Research data management (RDM) is a process from planning to preservation throughout the research process and data lifecycle [1]. A RDM plan is one of the requirements in funding agencies like NSF and NIH. In Canada, the Tri-agencies (CIHR, NSERC, SSHRC) also released their draft Tri-Agency Research Data Management Policy and Portage Network supports librarians and researchers in this regard. Although our study was exploratory and no RDM requirement involved, I thought that it was still a good practice to follow RDM.
1. R and RStudio
I chose R as my statistical language and RStudio as my IDE for our project. When I was a student at university, I was introduced to different statistical programs including SPSS and MATLAB, but once I finished my school, they were no longer available for free. Then, I learned R which is an open source yet very powerful language for data analysis and visualization. RStudio is an also open source IDE for R. In addition, there are many R packages available developed by communities not only for quantitative analysis but also qualitative analysis and RStudio provides great features to keep track of your scripts, console, datasets and visualizations in one place.
2. Gather uoCal data and Compute Canada
For this study, I didn’t need to generate new datasets. Rather, I needed to scrape uoCal data from its website. I didn’t know how many event records were available, but since uoCal uses Drupal as its content management system, I figured them out roughly by its url pattern - /en/node/number. When I downloaded, it was up to 22,500. Although some of the event records have been unpublished (not accessible), it could be still a lot to manually go through an individual url.
I used Compute Canada which is high performance computing as it is available for uOttawa researchers, so I initiated running my R script in one of the Compute Canada environment before I left my work and the next day, there were 10,757 event records scrapped from uoCal on November 22, 2018. The original csv was generated from my Rscript and saved in the Compute Canada environment as an original copy.
Note: You can directly run your Rscript in your computer, but it would take much longer time to download datasets from a website, especially when your datasets are really large.
3. Import uoCal to RStudio and data storage
I downloaded my original csv file to my computer from Compute Canada and imported the csv file to the RStudio as a data frame. Because I switch my workstation between Windows and MacBook a lot, I usually set my directory and create my RStudio project in the cloud-based storage such as Google Drive. Since the datasets didn’t have any sensitive information, it wasn’t needed a super secure storage. My previous institution provided different options for storage and secure storage for sensitive research data. uOttawa also provides three options for file storage.
Note: I didn’t choose an uOttawa institutional Google Drive as I had to request an account with Central IT. Rather, I chose my personal Google Drive for this study.
4. Clean and wrangle uoCal data in RStudio
As I mentioned, RStudio is a great tool to manage your datasets effectively as it provides script, console, data environment, history, packages, files, and etc. in one place. You can achieve this with a feature called Project.
RStudio
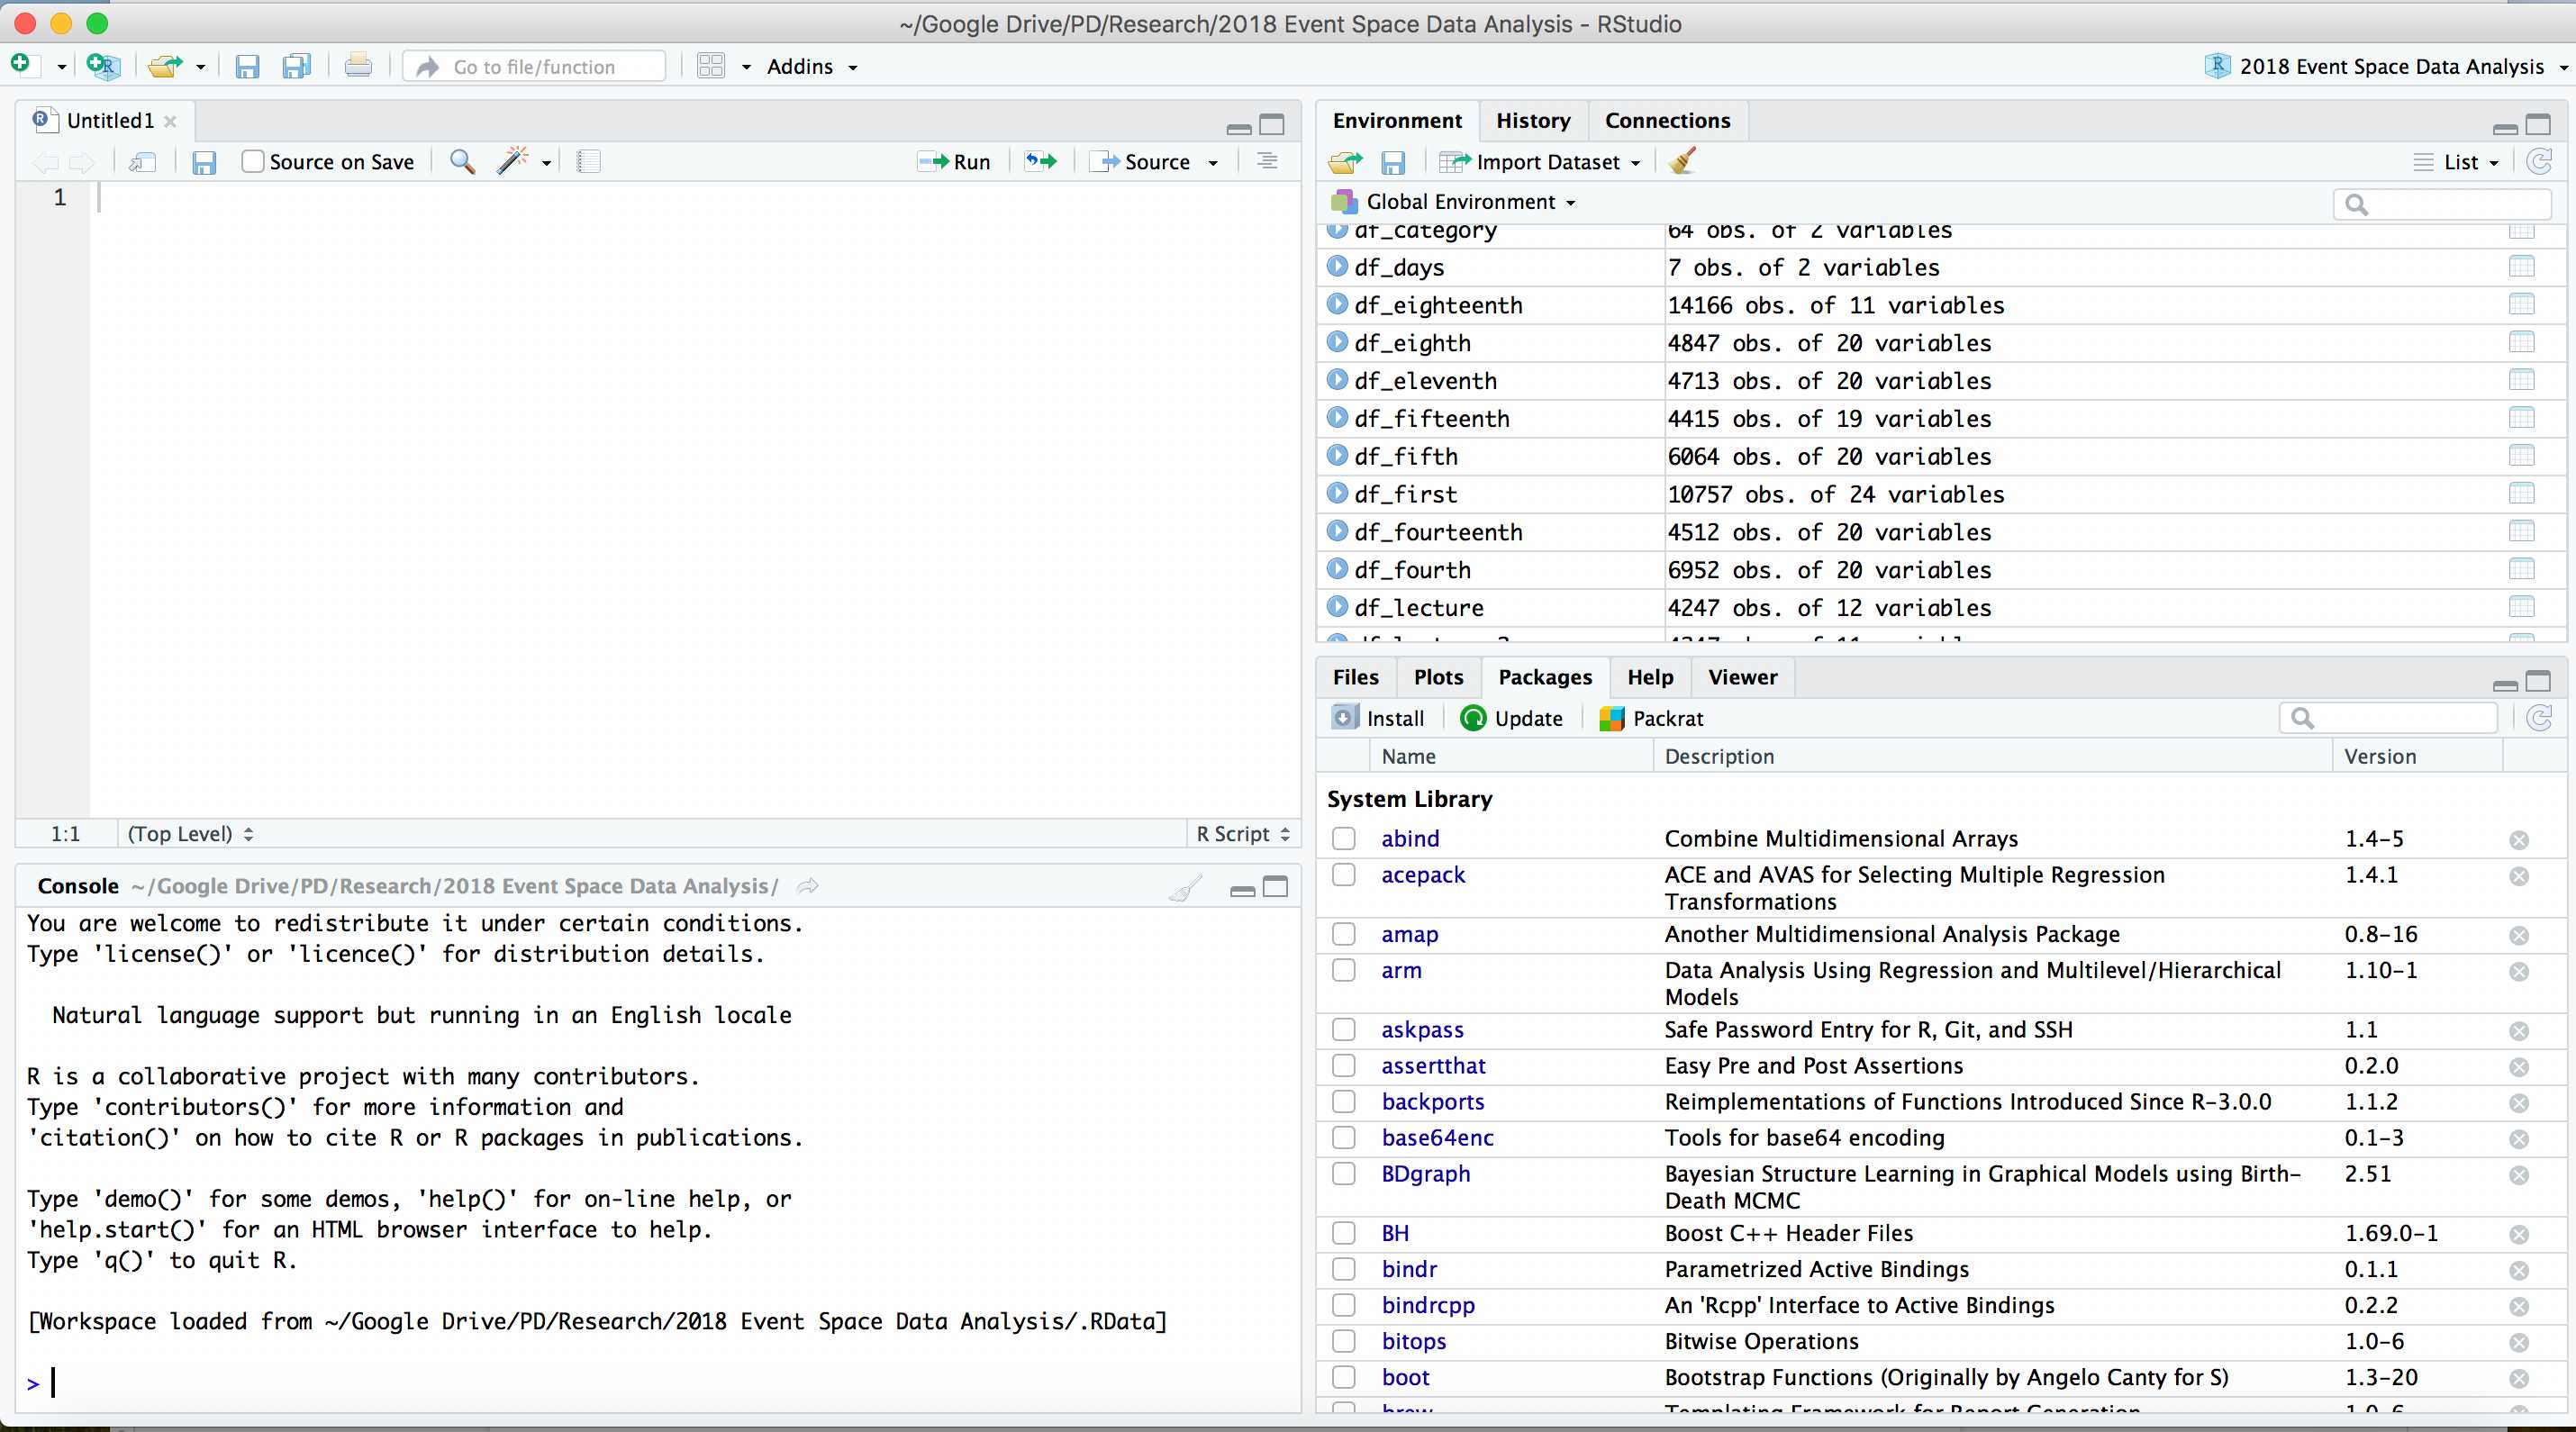
Your RStudio project is saved as .Rproj which enables loading your setting and restoring your R scripts that you worked on, working history such as commands you used, and data frames that you created via .RHISTORY file and .RDATA file. I found that the Project saved my time from setting up my environment every single time. In addition, RStudio provides version control like git or Subversion and you can integrate your data workflow with git and Github as your remote repository.
Over the course of your research process, you need to mung your original datasets which could be quite messy and not yet ready for data analysis. In my recent study, I had to re-format date and time so that I could remove duplicated event records of English and French, break one column into multiple columns, merge multiple columns into one column, and etc. Instead of overriding the original data frame, I always create a new data frame as df_1, df_2, …. until df_final for major changes and then saved df_final as df_final.csv. I found this is really helpful, especially when I make some mistakes during data wrangling processes. This allows me to go back to previous steps with precedent data frames.
When I started the RStudio Project for the first time, I didn’t know how to document effectively. Without any helpful comments in my script, it took a bit of time to fully understand my scripts when I opened later. I discover that there are always four steps involved - cleaning, wrangling, analyzing, and visualizing. I create these R scripts separately and always comment how and why I do. This is easier to find your code later if you need to re-run your script. For example, Cecilia and I made a poster and data visualizations were generated all for slide presentations. I had to go back to my script and increased font size bigger. Since I documented in my R script as a comment, I just tweaked a line of code and re-ran. No need to rewrite your code.
5. Data sharing
Since I didn’t generate datasets, it would be tricky to share this study datasets. I consulted briefly with Mélanie Brunet, Copyright Services Librarian and Thomas Rouleau, Officer and Manager of Copyright Services. It wouldn’t be an issue to re-use uoCal data for this type of research, but sharing couldn’t be possible due to copyright. Some of the uoCal might be created by APUO (Association of Professors of the University of Ottawa) members.
According to its collective agreement - 35.2.1.1,
Except as provided for in 35.2.1.3 the Parties agree that the Member holds the copyright with respect to any original work produced even where such work was produced with the use of Employer facilities, support personnel or services where such use does not result in additional cost to the Employer.
They also consulted me about sharing my scripts and there could be no issue, so I plan to share them once Cecilia and I finish our publication. Since I don’t have datasets, I thought that Dataverse isn’t appropriate. However, if you have datasets with metadata like README file, Dataverse is a great tool to share your data with your codes and it is also supported by the uOttawa Library. In my case, since these could be just R scripts for reproducible codes, I will use my Github repo which is connected with my RStudio for this project.
Conclusion
I found that R with RStudio is really powerful for any type of data analysis and visualization. My RDM could be possibly wrong, but RStudio could be easily integrated within RDM as RStudio provides great tools from gathering data to sharing data in a nutshell.
Note: Please let me know if I did something wrong. I’d like to learn and improve my practice. Thank you.